Bias in data science and machine learning
Of all the problems that may crop up in the machine learning lifecycle (acquire data, train a model, test the model, deploy, and monitor), biased data is the one that worries me the most because it starts in the very first step, when we acquire data for the model. All steps after that are affected by it.
Once we start with a biased dataset, the model is doomed. There is no action we can take later in the lifecycle to completely correct it. Training more, training “better” (however that’s defined), testing more, will not correct the biased dataset.
To top it off, we will likely not realize that the model is biased until it is used in production, where it can inflict real damage. While we are in the train/verify step, we happily verify the model against the dataset we collected. The numbers will look good because we are verifying the model against the flawed data used to create it.
Sources of bias
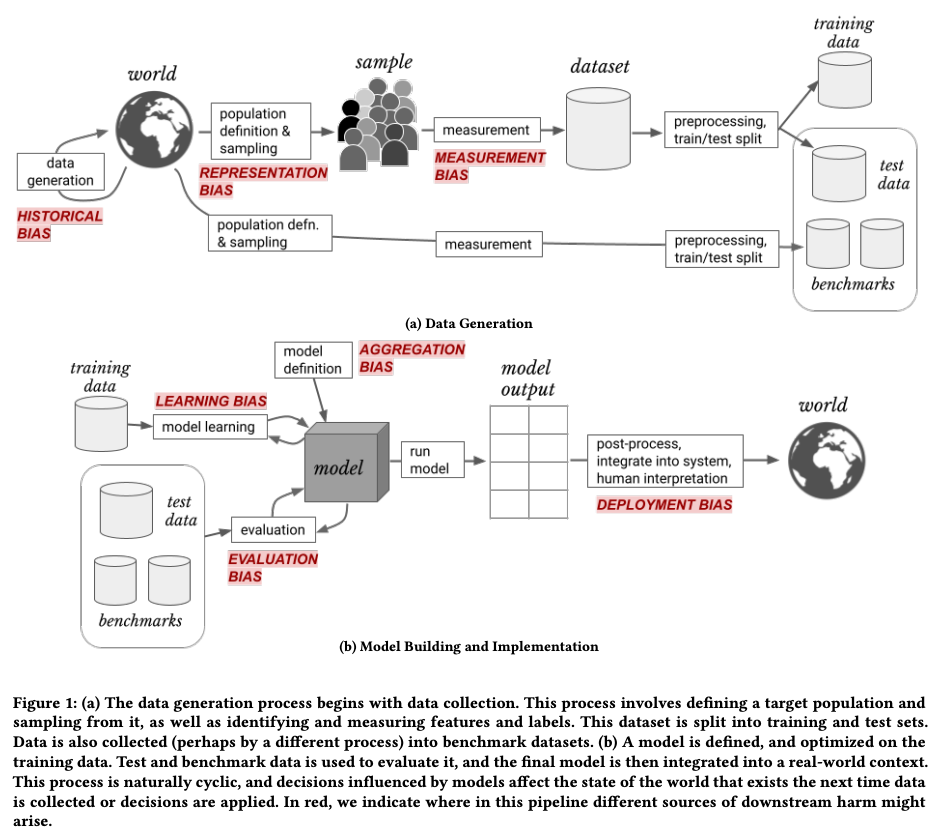
If biased data is so damaging, understanding where it comes from helps us recognize and correct the problem early on. Some time ago, I came across a paper that categorizes the sources of bias in the machine learning lifecycle: “A Framework for Understanding Sources of Harm throughout the Machine Learning Life Cycle”. They split the sources of bias into two phases:
- Data generation: the collection of the raw data and creation of the dataset,
- Model building and implementation: training and using the model.
In each phase, they identify multiple sources of bias, as illustrated in this picture:
 Picture source: A Framework for Understanding Sources of Harm throughout the Machine Learning Life Cycle.
Once we have a framework to identify the sources of bias, we can better prevent it. In the authors’ words:
Understanding the implications of each stage in the data generation process can reveal more direct and meaningful ways to prevent or address harmful downstream consequences that overly broad terms like “biased data” can mask.’
H. Suresh, J. Guttag — A Framework for Understanding Sources of Harm throughout the Machine Learning Life Cycle
These are the sources of bias in the machine learning lifecycle, starting from the early stages and moving to the late stages.
Historical bias
The state of the world affects the data we are collecting. For example, a campaign to raise awareness for stroke signs affects data collection for a drug to treat it (recognizing stroke signs early makes them easier to treat, increasing survival rates in ways that are unrelated to the drug being analyzed).
More complex examples involve secular trends, the changes in a large population (e.g. a country or even the entire planet) over time. For example, better diet and education affect a host of other variables in subtle ways. This CDC article is a good explanation of the effect of historical bias on healthcare studies.
Representation bias
The sampled population does not represent the target population. This is probably the easiest one to identify when humans are involved. We can check for race, age, and other factors relatively simply.
It’s more complicated when the definition of “population” is not that clear. For example, training a model to detect diseases in X-rays is affected by the source of the X-rays. Sicker people have X-rays taken in the emergency care facility, while healthier people have X-rays taken in a clinical setting. Not accounting for that factor can result in an X-ray dataset of overwhelmingly sicker or healthier people. Is that a problem? It depends on the target population of our model. If we are developing a model to be used in emergency rooms, it would benefit from being trained in the X-rays from the emergency room and would perform poorly if trained with the X-rays from the clinics.
Thus, representation bias is not a statement about the population in general, but about the target population.
Measurement bias
Introduced when we don’t have the quantity we want to measure and choose a proxy for it. For example, using “number of arrests” as a proxy for “probability of committing a crime” (arrests don’t necessarily correlate to conviction - more on it later). This is different from measurement error, where we have the data we want to collect, but fail to collect it correctly.
Aggregation bias
Occurs when we lump together the data points in too broad categories. For example, aggregating a dataset by gender to make decisions, not considering that other factors, such as age groups, education level, or income level, also affect the outcomes. This article has some examples from economics.
Learning bias
Choices made when training a model amplify biases in the dataset. For example, pruning removes from a neural network nodes (weights) that do not contribute to the accuracy (or any other metric used to evaluate the network). However, these nodes may encode information about populations underrepresented in the dataset. Removing them exacerbates biases against those populations.
Evaluation bias
Caused by evaluating the model against data that does not represent the population it will be used with. It starts by improperly defining what the model is attempting to predict. For example, models to classify images are commonly evaluated against ImageNet, which is geographically skewed. The best we can say for such an image classifier is that “it performs well in an image dataset that is skewed towards developed western countries”.
Deployment bias
In this framework, this is the only bias not directly related to the dataset. It is caused by applying the model to a situation it was not meant to be used. For example, using an X-ray disease detection model is used to help doctors identify and diagnose diseases. If it is used to perform the final diagnosis, instead of helping doctors diagnose, we land in a deployment bias case.
A famous case of a biased model
Probably the most well-published case of a racially biased algorithm in the US: COMPAS, a program to help judges release defendants while they await trial (vs. keeping them in jail until the trial date), was biased against black defendants, even though it explicitly does not use race as one of the decision factors.
However, there are enough other proxies for race in datasets. For example, using “number of arrests” as a proxy for “probability to commit a crime” is biased against minorities because the police have a history of arresting a disproportionately higher number of minorities. Not to mention that “arrest” and “conviction” are not necessarily correlated.
There are many articles dissecting the biases in COMPAS. One of my favorites is the one from MIT’s Technology Review. It has good explorable illustrations of the problem. You can play with the algorithm decision process to see how the thresholds affect the outcomes for different populations.
Bias by proxy
The example above is a case of “bias by proxy”. Even though it does not use race directly, other attributes (e.g. number of arrests), are influenced by race. They end up indirectly representing race in the prediction process.
Another example of bias by proxy is in healthcare. An algorithm to prescribe the amount of care used “money spent on healthcare so far” as a factor in predicting “how much healthcare will be needed in the future”. The algorithm’s goal was to identify unhealthy people and allocate resources (medical visits, etc.) to them. But it didn’t have a clear-cut “this person is healthy/unhealthy” attribute in the dataset. To identify unhealthy people, it used “money spent on healthcare so far” as a proxy. In other words, it assumed that people who spent more money on healthcare are sicker in general, thus need to be allocated more healthcare resources in the future.
The flaw in this thought process is that disadvantaged communities spend less on healthcare not because they are less sick but because they do not have the resources to spend more. In a crude, oversimplified way, the algorithm predicted that wealthier people were sicker simply because they spent more on healthcare in the past, then proceeded to allocate more healthcare resources to these people (it’s a bit more complicated than that - the article goes into the details and it is interesting reading).
How can we detect and prevent bias?
Some biases can be detected with analytical methods and tools. These tools usually explore cross-sectional representations of the dataset, for example, the proportion of male vs. female, religion, different age groups, etc. Some of these tools include
- TensorFlow fairness indicator
- TensorFlow What-If tool to investigate the model behavior
- Microsoft’s Fairlearn
- IBM’s AI Fairness 360
- Know Your Data
The analytical tools and methods help, but they are after the fact. The dataset and perhaps even the model are already in place.
Besides detecting bias, we also need methods to prevent the introduction of bias when creating datasets and models. Datasheets for datasets and model cards are methods to bring human judgment into the process. They guide researchers and machine learning practitioners in the early stages of the dataset and model creation by asking pointed questions. This early intervention can help reduce bias that would go unnoticed or would be hard to eliminate if found in late stages.
Learning more about bias
- Visual exploration of bias: Hidden Bias explorable (Google’s AI Explorables page)
- A Survey on Bias and Fairness in Machine Learning
- The “Fairness and Machine Learning” book (free)