What is “model accuracy”, really?
In the book Responsible Machine Learning, when discussing trust and risk, the authors recommend a list of questions to ask to understand the risk of a machine learning (ML) deployment.
One of the questions is “What is the quality of the model? (Accuracy, AUC/ROC, F1)”. These metrics compare correct and incorrect predictions of a model.
But how exactly a model determines what a correct prediction is?
Here we will analyze the effect of an important factor a model uses to decide the correct prediction (label) for classification problems, the decision threshold. We will see that without understanding how a model decides what “correct” is, talking about the model’s accuracy is premature.
We use accuracy in this text as the number of correct predictions on the test set, divided by the number of instances in the test set.
                 Number of correct predictions
   Accuracy = -----------------------------------
                 Number of instances predicted
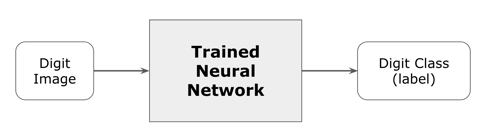
To illustrate the discussion, we will use an image classification model (simplification disclaimer: there are other types of problems, e.g. regression, and other types of models – we are making simplifications to expose the main concept.)
A typical image classification problem, taught early in machine learning, is digit classification with the MNIST dataset. The dataset looks like this (a small sample - the dataset has 70,000 images):
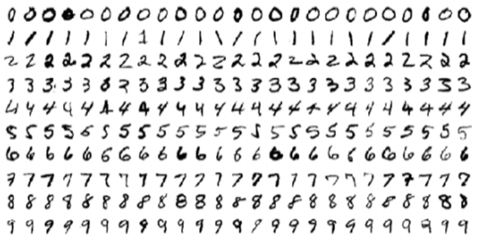
In an image classification problem, we train a model to identify an image’s class (label). In this case, there are ten classes, one for each digit (from zero to nine).
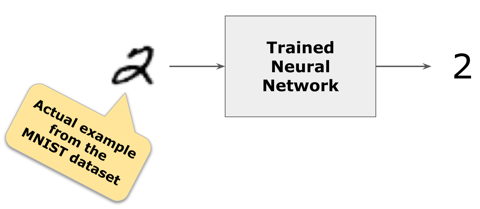
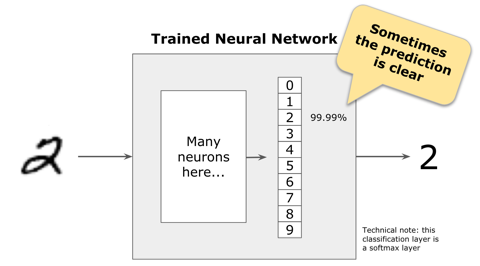
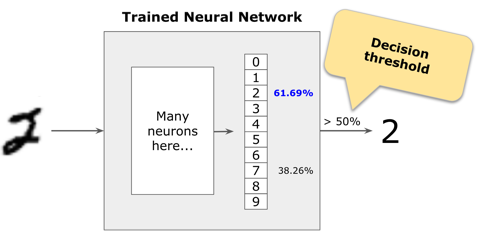
This is an actual digit from MNIST. The model correctly classifies it as the digit “2”.
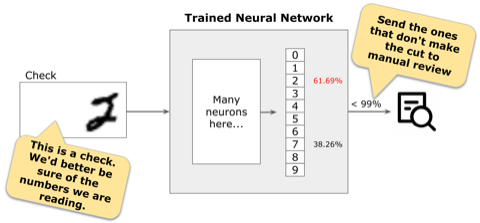
A neural network has several hidden layers to extract (“learn”) features from the images. The very last layer is the one that classifies the image. In this case, we are classifying ten classes (ten digits). Therefore the last layer has ten neurons, one for each digit.
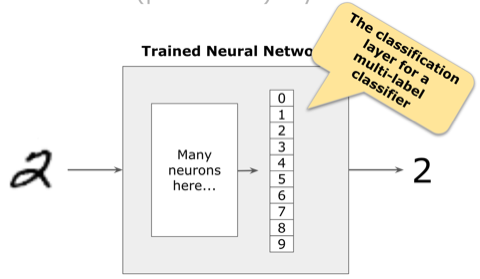
Because we want to know what digit it is, we use softmax activation in the last layer to give us a probability distribution of each class. The model is confident that the image is a number “2” in the case below.
For other images, the model may not be so confident.
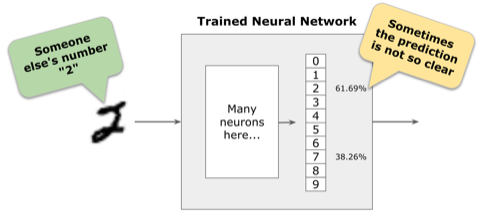
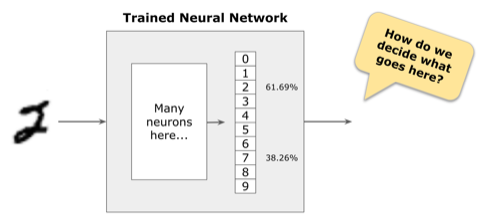
In those cases, how should we decide what the label is?
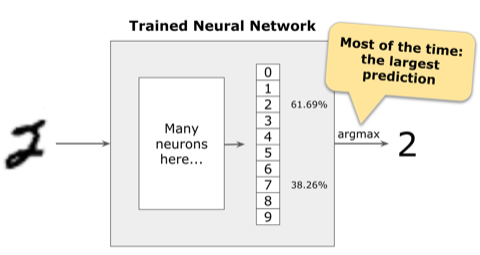
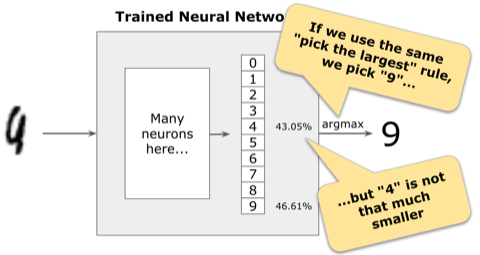
Most of the time, the class with the largest probability is used as the label. In this example, the model classifies the image as the digit “2”.
But what should the model do when the largest probability is not that high and is close to the probability of other classes?
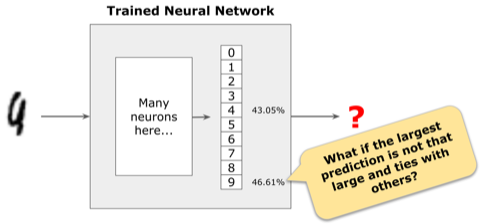
In the example below, the largest probability is for class “9”, but it is not even 50%, and the probability for class “4” is not too far behind. The model does not have high confidence in this prediction.
What should we do in these cases?
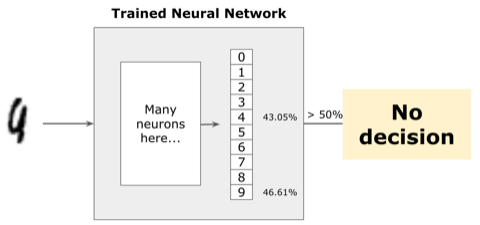
To solve those cases, we usually pick a threshold for the decision. Instead of simply using the class with the maximum probability, we select the largest probability above the threshold we chose. If we choose 50% as the threshold, in the number “2” example above we are still able to classify the image as the number “2”.
But now we no longer classify the ambiguous image as a number “9”. In this case, we would not make a decision at all.
But what threshold do we pick?
It depends. For high-stakes applications where wrong decisions have severe consequences, we want to be very confident in the model’s prediction.
For example, for an automatic check deposit application, we want the model to be at least 99% confident of the prediction. Any image below that threshold is sent for human review.
Effect of different thresholds
The higher the threshold for the decision, the fewer images the model can classify. For the model used in these examples, this is the effect of different thresholds on the model’s accuracy.
| Threshold | Accuracy |
|---|---|
| 99.99% | 48.7% |
| 99.9% | 75.6% |
| 99% | 90.0% |
| 90% | 96.4% |
| 80% | 97.8% |
| 75% | 97.8% |
| 67% | 98.2% |
| 50% | 98.8% |
Asking questions about “accuracy”
The one-line takeaway: to use a model responsibly we must ask questions about how its accuracy was measured and not just accept published numbers.
- How predictions are being made: is it probability-based (as in the examples above)? Something else?
- What factors control the predictions: is it threshold-based or some other decision (e.g. argmax)? If it is threshold-based, what are the thresholds?
“We achieved 99.9% accuracy on [some task here]” means nothing if it’s not accompanied by a detailed description of what a “correct prediction” is for the model.
What to use instead of accuracy?
Balanced datasets have similar numbers of instances for each class. For these cases, a better alternative to accuracy is the receiver operating characteristic (ROC) curve (for a simpler introduction, see this page). The ROC curve shows, at a glance, how a model behaves with different thresholds.
Imbalanced datasets have a large number of instances for one of the classes and a small number of instances for the other classes. Accuracy is an especially flawed metric for imbalanced datasets with a small number of positive class instances. These datasets are typical in healthcare applications where a specific condition affects only a small portion of the population. For example, if a disease affects only 0.1% of the population, a “classifier” that always returns “no disease” without even looking at the data is 99.9% “accurate”. In these cases, precision and recall are better metrics. The Precision-Recall Plot is More Informative than the ROC Plot when Evaluating Binary Classifiers on Imbalanced Datasets explains in detail, with concrete examples why should prefer the precision-recall plot for imbalanced datasets with a small number of positive instances.
Every scientific paper that describes a model should publish the ROC or precision-recall curve. Papers that publish only the accuracy for the model, and especially papers that publish the accuracy without specifying the threshold, are, at best, incomplete. At worst, they were written by uninformed machine learning novices.
Experimenting with the code
The code is available on this GitHub repository. You can experiment with different digits and classification thresholds to see the effect on the model’s accuracy.